
This course consists of two consecutive, integrated parts, spread over four weeks
The first section: Establishing basic concepts and ideas in statistics and statistical analysis.
The second section: practical application to the SPSS program for calculating statistical indicators and their tests.
The course The course lectures during its four weeks include:
- The first week: the first entrance
We will answer a set of questions, including:
- What is statistics? Why do we have to know and learn it?
- Does the census mean in our daily personal life?
- Does the census mean in our academic studies?
- Is the statistics sector in our professional fields of work?
In it, we will learn together the definition of statistics, its importance, and its use at the individual and institutional levels, as well as many other knowledge about statistics.
We will learn together the following topics:
- The difference between descriptive statistics and applied statistics
- Data and its relationship to statistics.
- Different data types.
- The second week: data and methods of collecting them
In this lecture, you will be introduced to a wide range of methods and methods of data collection, with examples and practical cases that include an explanation of the most important correct practices for accurate data collection and the most common errors in data collection.
The following topics will be covered:
- What was awareness prior to data collection?
- Data Collection Methods / Comprehensive Inventory, Honey /
- Types of random and non-random
- Sources of data collection and comparison between them
- The most important tools and methods of data collection in the practical and academic fields
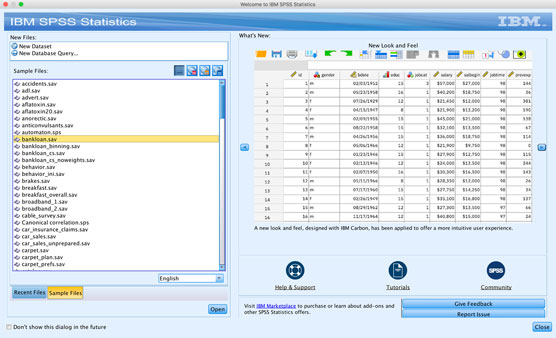
The third week: the SPSS program.
We start on the program in its 25th version and learn about how to install, define variables and enter data through the program
The following topics will be covered:
- Why SPSS? Its pros and cons
- Install the program on the computer
- Program destinations and SR
- Define variables
- Data Entry
What do we do after entering the data? :
In this lecture, we will start with the descriptive statistical analysis and its practical steps with practical examples and many practical cases.
The following topics will be covered:
- Calculation of descriptive statistical indicators
- Percentage and Percentage Corrected
- Measures of central tendency
- Dispersion measures
- Graphs
- Junction tables
The fourth week: a comprehensive case of operation
We conclude the course with a comprehensive applied example of all the above ideas and concepts to establish and re-explain them.
Course entry requirements
The given scientific material is characterized by being smooth and intellectually connected. Therefore: The subject requires continuous follow-up during the lectures first by first to prevent accumulation, the ability to reach the highest possible benefit, the ability to pass the test and solve periodic interactive problems within the course.